The growth in the use of smartphones in Uganda has facilitated the increase in Internet usage and internet subscribers in the country. The Internet has provided a fertile ground to generate huge amounts of information on various web and mobile based social media platforms. Social media platforms have overtaken traditional media in facilitating social interactions on real time events. The ever increasing number of social media users has resulted in an increase in social media content. This content has proven to be helpful for decision making. However, since there are no restrictions and limitations on the content posted on social media platforms, it has turned out that some of the posted content is invalid, inaccurate, potentially and intentionally harmful. This poses a need to develop solutions that can be used to detect false information and misinformation in social media text. Several studies have sought and continue to detect negative and inaccurate content shared on social media platforms. However, most of this research has focused on the English language and thus these applications can not be used in contexts that include low resourced languages like Luganda, a major local language in Uganda that is also commonly used on social media platforms.
The focus of this research was on building a system for misinformation detection and sentiment analysis from social media text on Ugandan social media platforms. Our focus was mainly around social media content related to the current COVID-19 pandemic in Uganda. This was important to understand perceptions of Ugandas related to Uganda Government’s COVID-19 transmission mitigation strategies from social media data. As a first step, we collected data related to COVID-19 from Facebook and Twitter using open source scraping tools. The data was analyzed and some of the key findings were that the text was in English, Luganda or a codemix of English and other local Ugandan languages like Luganda and Runyankole. For privacy reasons, the data was anonymized to remove any personal identification information.
To prepare the dataset for machine learning tasks, the data was annotated using the open source Doccano annotation tool. Prior to the data annotation task, annotation guidelines were defined which guided the annotation activity.
Each social media datapoint was given the following labels:
- Data Source: Facebook or Twitter
- Language:
- English- text data point is purely in English.
- Luganda - text data point is purely in Luganda.
- Codeswitched- text data point contains words in English and Luganda or in English and Runyankole.
- Misinformation: To model for misinformation analysis; four labels were used:
- Fake - statement is misleading.
- Not_Fake - statement is not misleading.
- Partially Fake - part of the statement is misleading.
- Others - scenarios where we couldn't prove whether the statement is false or not false.
- Aspect: Topics on COVID-19 which included: COVID-19, Cases, Standard Operating Procedures (SOPs), Non-pharmaceutical Interventions (NPIs), Truck drivers, Hospitals, Vaccine, Elections, Treatment, Testing, COVID-19 Impact, Border, COVID-19 Relief, Presidential address, Death
- Sentiment: Tagged per Aspect with label of: Neutral, Positive and Negative.
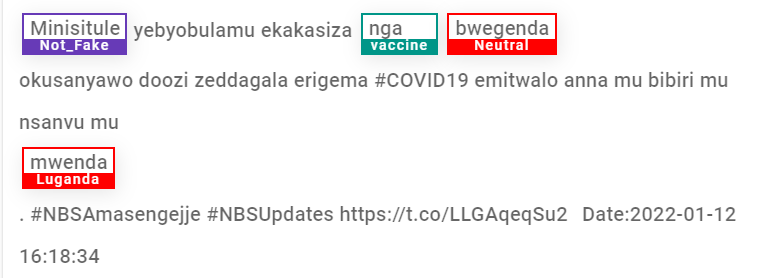
The figure above, shows an annotation of social media data in Luganda with the misinformation tagged as Not_Fake and the aspect identified being Vaccine with a Neutral sentiment.
After data annotation, we carried out an exploratory data analysis of the annotated data set that consisted of 11,000 text data points.The data obtained from Twitter contributed the highest percentage 51.4% compared to Facebook data with 48.6%. 93% of the annotated data points were in English while Luganda and Codemixed data points formed 5% and 1% respectively.


To gain more insights from the data, we drafted research questions to guide the data analysis.
Question 1: What is the spread of misinformation in the data obtained from Twitter compared to the data obtained from Facebook?
To answer this question, we considered the misinformation label in the data. Much as Twitter data was more than the Facebook data in terms of quantity, most of the data tagged with the 'Fake', and 'Partially Fake' labels was the Facebook data. This can be attributed to the data that we obtained from Facebook that allowed us to include people’s comments to the Facebook posts compared to the Twitter data where we were restricted to only the posts made by the accounts scrapped. Moreover, Twitter has a limited tweet length of 280 characters compared to Facebook which means that while people make posts on Facebook, they are at liberty to write more which can turn out to be a source of misinformation. The demographic of Twitter and Facebook users is highly varied with more elites and corporate individuals on Twitter compared to Facebook. Corporates are more conscious about what they post and double check their posts or tweets.

Question 2: What is the spread of misinformation in the English social media data compared to Luganda or code switched data?
A categorization based on language was made to compare the levels of misinformation associated with a particular language.
From this analysis, it was observed that most of the 'Fake' and 'Not Fake' posts were written in English while most of the posts in Luganda and codemixed were tagged as 'Not_Fake' or 'Others'.

Question 3: What is the spread of misinformation in the social media data obtained in 2020 compared to data obtained in 2021?
Generally, we observe that we had more posts with the misinformation labels: 'Fake', and 'Partially Fake' in 2021 compared to 2020.

We also analyzed the misinformation data for 2021. From the data analysis, we observe that we had more posts labeled with misinformation in June and July 2021 compared to other months in the year. In June 2021, Uganda experienced its highest number of COVID-19 cases and deaths. This was attributed to the emergence of the Delta variant in the country. Furthermore, all institutions of higher learning were closed in June and a 42 days lockdown was announced for the transport and business sector. The lockdown was then lifted towards the end of July, however, schools remained closed. Considering all the events that were going on in the country at that time, we observed that there were many posts made on social media platforms and part of the data had misinformation labels.
Sample data points for that period:
A: “Covid19 is now a fertile business in Uganda, continue getting the money you in government”.
We observe that this post has misinformation on COVID-19. Our model was able to classify this post as “Fake” with a Negative sentiment.
B: “Okunoonyereza okukoleddwa ekitongole kulaze nti obwelaliikirivu bweyongedde mu bannayuganda olwembeera yekirwadde kya Covid-19 ekiyinza okwongera embeera yokwennyika ssinakindi endwadde zemitwe mu ggwanga”.
We observe that the post was about a research conducted on the impact of COVID-19. Our model was able to classify this post as “Not_Fake” with a Negative sentiment.
Question 4: What is the correlation between the sentiments across different aspects in the social media dataset ?
During the COVID-19 pandemic, a number of topics drove conversations on social media platforms. These aspects ranged from the COVID-19 symptoms, COVID-19 restrictions by the government and their effects. The posts and tweets made about COVID-19, Non Pharmaceutical Interventions (NPIs) which included closure of schools, businesses and curfew, and COVID-19 cases had more negative sentiments. All these aspects had a negative impact on the people which justifies the results obtained. For example, some were about closure of people’s business, deaths of loved ones and family members. Additionally aspects like COVID relief and treatment had positive sentiment this can be attributed to the food and cash relief issued by the government and the many recoveries witnessed from the COVID-19 patients.

In conclusion, we see the potential in analyzing social media data to understand people’s sentiments to COVID-19 and its mitigation strategies in the country. We also observe that there is potential for the use of social media data for the spread of misinformation and the need to build misinformation classification models based on machine learning.