Smallholder farming is a predominant global agricultural system. In the developing world, it takes the lion share, for instance, in Ethiopia, it produced about 95% of
main crops and cash crops. Despite its dominance, this farming practice, largely, is characterized by low crop productivity and absence of, and if there is any, the use of
old-age unproductive technologies. Consequently, millions of societies around the globe are threatened by food insecurity. Countries like Ethiopia, for instance, imported
30% - 50% of their wheat demand annually.
With the fast advancement of space technologies, remote sensing (RS)-based prediction methods are preferred over traditional tiresome and costly ground surveys.
In harnessing the potential of remote sensing technologies, optical and radar sensors, in their order, probably are the two widely explored technologies. Existing
prediction methods, which often operate at national and regional scales, exploit the potential of the well-established coarse spatial and temporal resolution sensors.
Nonetheless, the resolution of these sensors has limited their application for field-scale prediction in smallholder systems. Data mining methods are also the
key components of prediction methods. Despite statistical methods are widely being exploited the new era methods: machine learning and deep learning present superior potential.
In this regard, this study was motivated to address some of challenges in yield prediction via setting threefold objective. First, the study aimed to evaluate the potential of selected vegetation indices derived from Sentinel-2 data that were representative of an optical sensor as wheat yield predictors. Second, it was set to evaluate the potential of selected SAR indices derived from Sentinel-1 data as wheat yield predictors. Third, we aimed to apply fast, reproducible, and open-source statistical, machine learning, and deep learning algorithms for wheat yield prediction.
Key Findings
This study aimed to develop a method for remote sensing-based wheat yield prediction. The study obtained predictors from vegetation indices derived from high-resolution optical and SAR sensors. Eight vegetation indices were computed from Sentinel-2 sensor, and five SAR indices were calculated from the Sentinel-1 sensor. In light of tapping the diverse potential, data mining methods, which are grouped under three broad categories: statistical, machine learning, and deep learning, were applied.
The combined-date SAR indices, such as SAR Normalized Difference (SND) and SAR Simple Ratio (SSR) showed relatively improved performance over single date SAR indices. Indices such as SND and SSR achieved values of 1.32 ton/ha and 1.20 ton/ha, and values of 1.24 ton/ha and 1.22 ton/ha for LOORMSE (leave-one-out RMSE) and RMSE, respectively. It is intuitive to expect combined-date indices integrating wider phenological information to outperform narrow ones, single date.
The most salient result of the current study is the successful application of an Automated Machine Learning platform, AutoML. The AutoML easily offers the 10 most powerful predictors (see figure 1) of
the total 48 predictors considered. The 10 influential predictors are:
1. lai1020ha (leaf area index dated on October 20 per hectare)
2. ndwi1010ha (normalized difference water index dated on October 10 per hectare)
3. lai1010ha (leaf area index dated on October 10 per hectare)
4. ndwi1015ha (normalized difference water index dated on October 15 per hectare)
5. mcari1010ha (modified chlorophyll absorption ratio Index dated on October 10 per hectare)
6. fapar1010ha (fraction of absorbed photosynthetically active radiation index dated on October 10 per hectare)
7. ndwi1020ha (normalized difference water index dated on October 20 per hectare)
8. vh1015ha (single date synthetic aperture radar cross polarized index dated on October 15 per hectare)
9. ndi451010ha (normalized difference index using band 4 and 5 dated on October 10 per hectare),
10. fapar1005ha (fraction of absorbed photosynthetically active radiation index dated on October 05 per hectare)
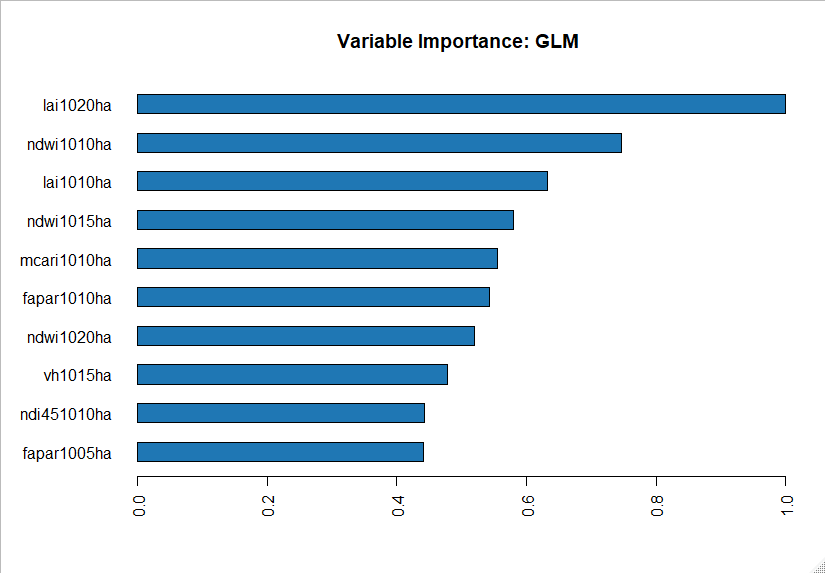
Figure 1. A plot showing the top ten most influential variables using the GLM model. Discriminating the ten parameters, a stand-alone algorithm: the GLM model, which happens the best of all the tested algorithms, revealed an RMSE of 0.84–0.98 ton/ha for the mean population at a 99% confidence interval (CI) on the test dataset, while the performance on the training dataset was 0.84–0.88 ton/ha. Of all the predictors evaluated, leaf area index calculated at the post-grain-filling stage is the most influential one (see figure 1 above).
Validation of results also implemented to come up with conclusive outputs (see figure 2). On the test dataset, six scatter plots for six GLM models using different seeds were computed. Accordingly, the correlation coefficient (r) between the estimated and measured yield ranges from 0.69 to 0.19.
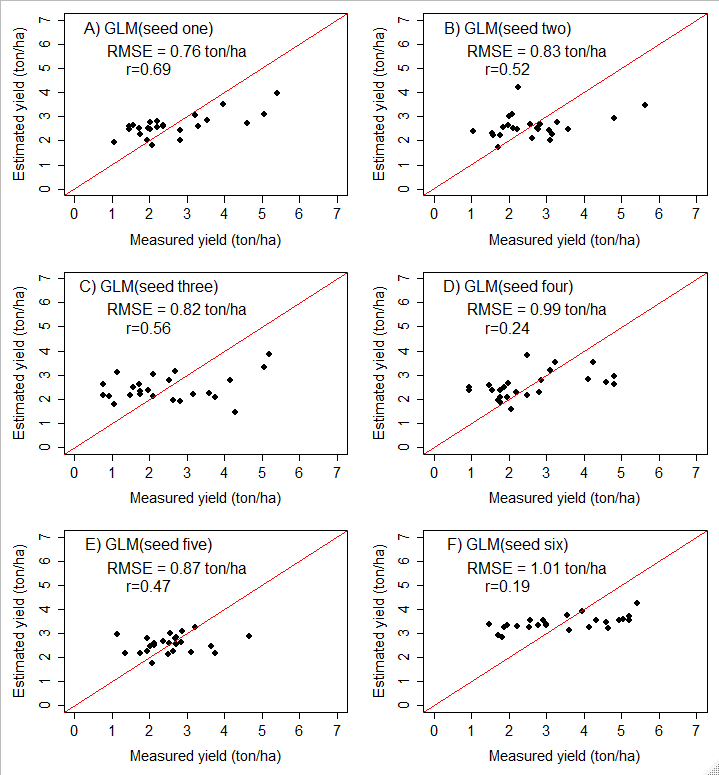
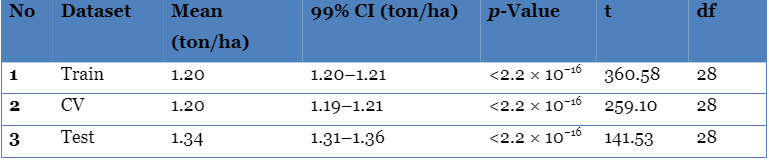
Figure 2. Scatter plots showing the performance of GLM on the test dataset for six randomly selected seeds. The red lines represent a 1:1 line between estimated and measured yields. Subfigures A–F refer to six plots prepared using six randomly generated numbers (seeds). performance. At a 99% confidence interval, the mean RMSE was 1.31–1.36 ton/ha on the test dataset (see table 1).
Table 1. Table showing RMSE (ton/ha) values at 99% CI for training, CV, and test datasets for three hidden layers.
Overall, the GLM model employing the ten most influential parameters revealed the best prediction results. Thus, the developed method employs both the capability of the AutomL package as well as the capability of GLM to search for hyperparameters. In terms of performance, revealing higher wheat prediction capability, this combined approach seems synergetic and fast compared to the rest ones.
Moreover, as the study was implemented under a small dataset and because the AutoML offered the ten most influential parameters, this contributed to the obtained higher performance. From a practical perspective, this has invaluable significance. The efficient and effective training of machine learning models is often a very daunting task. Nonetheless, in this study, better results were obtained using an automated machine learning method that can be easily implemented by experts having limited skills. This implies the scalability of the approach to environments with limited access to well-skilled experts and robust off-the-shelf data mining platforms.
Concluding Remarks
A combined method, the AutoML with GLM hyperparameter tuning, showed higher performance over the rest of the methods. Millions of farmers across the African continent and beyond could take the advantage of the AutoML with GLM hyperparameter method to predict wheat yield. Moreover, it could be adapted to predict grain yields for other cereal.